Analytics Page
An analytics tool that enables University administrators to answer nuanced questions about end-user software and content adoption.
- AI Prototyping
- Figma Component Library
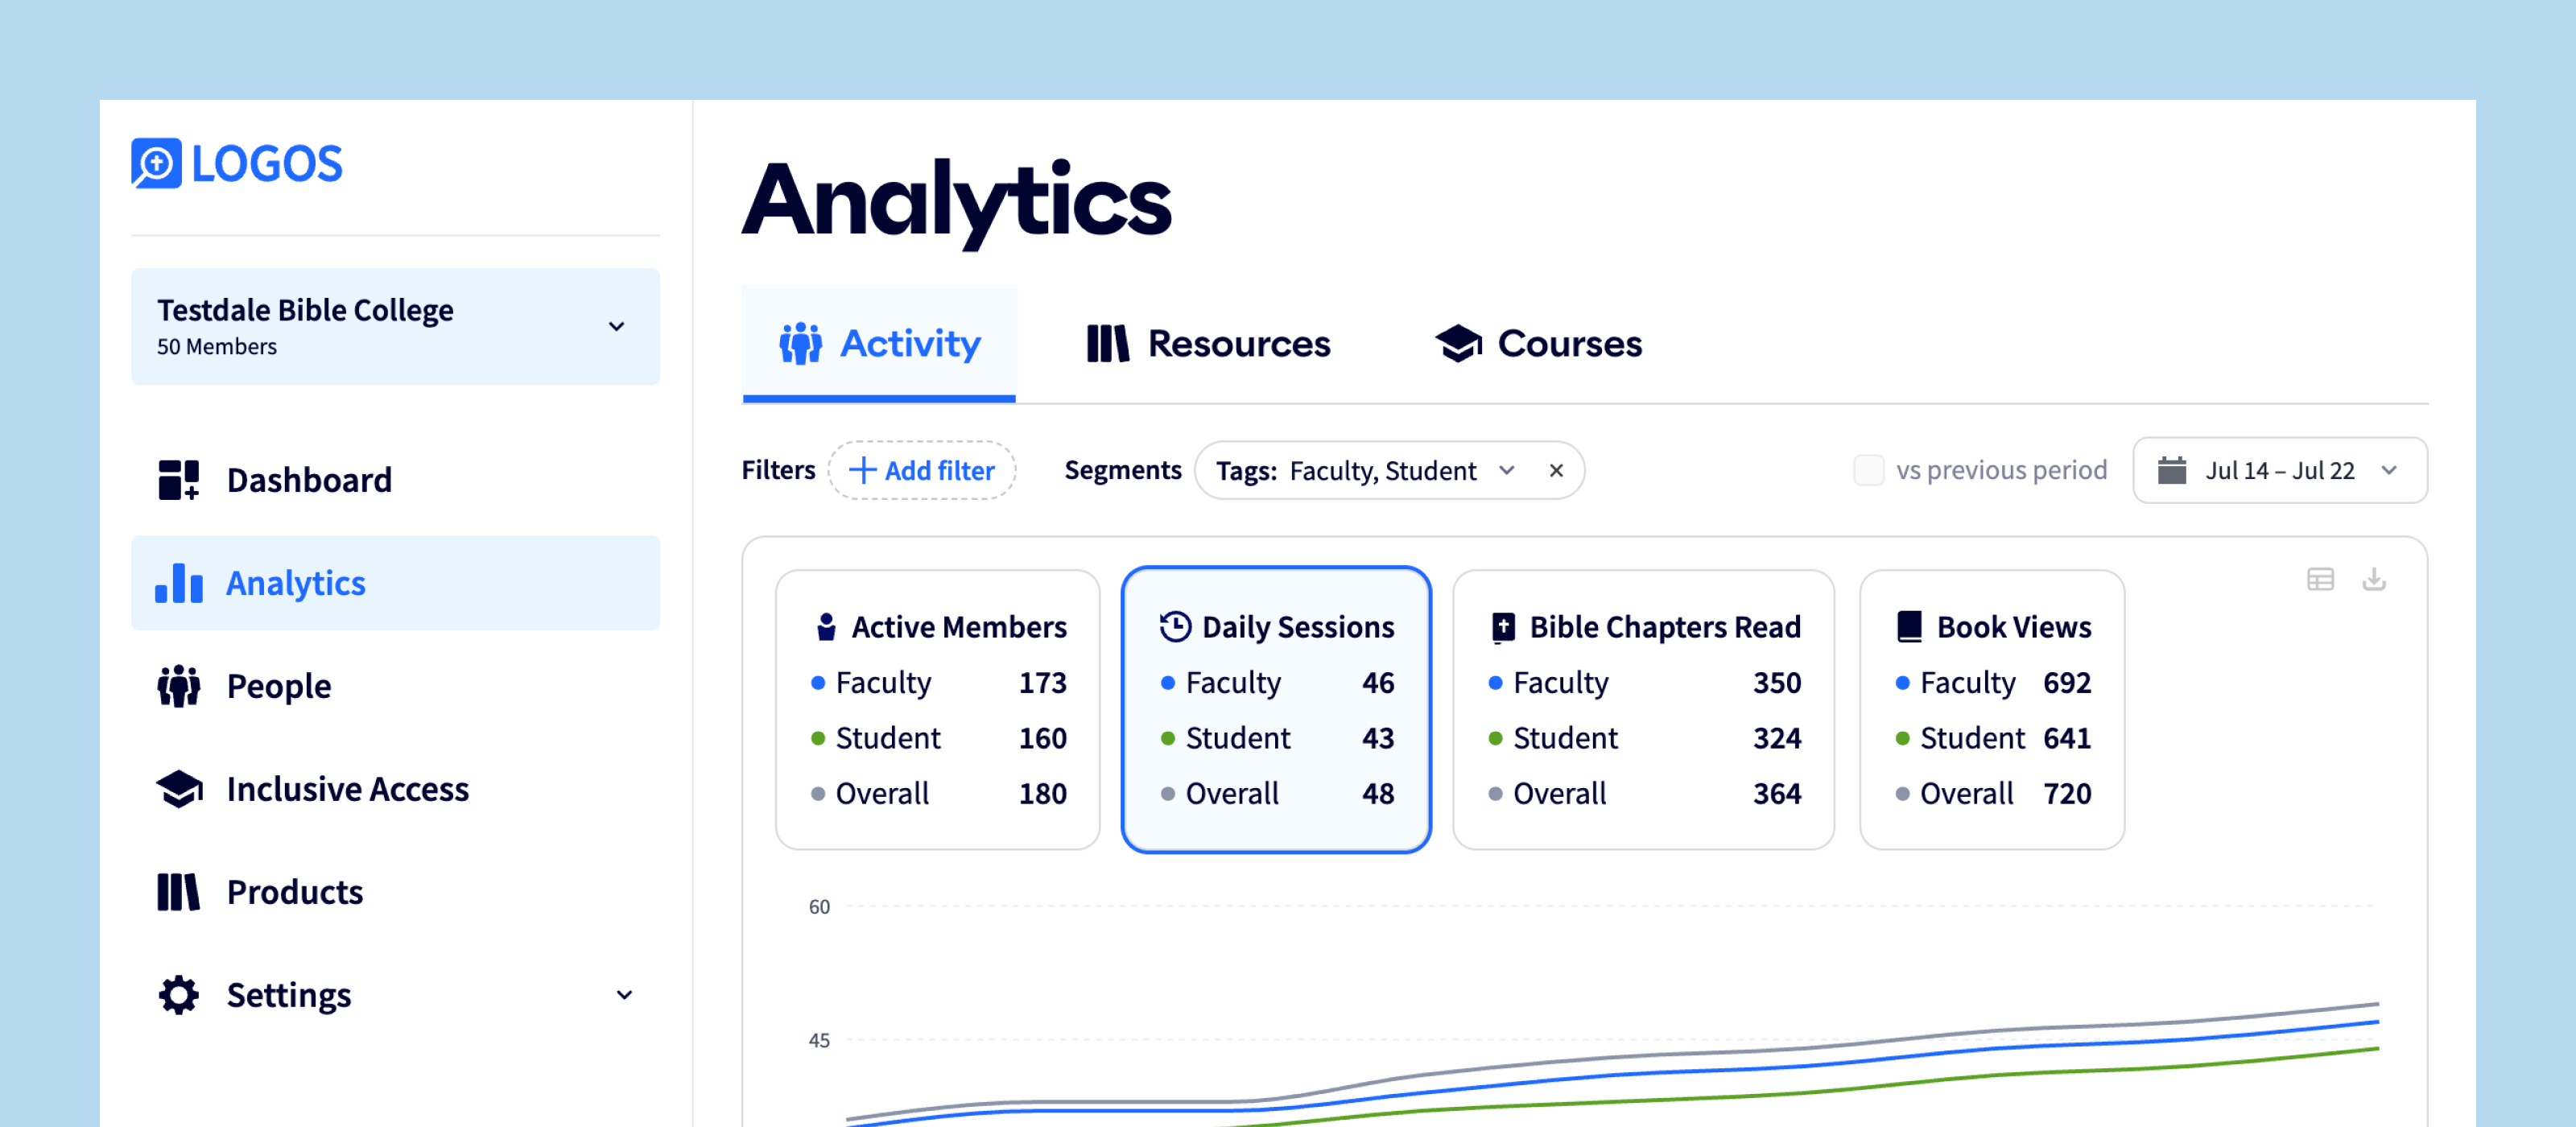
The Problem
The Dashboard Analytics section of the Admin Portal provided a 30-day summary of user engagement, and answered the most critical question, “are our people using Logos?” That was an important baseline, but our university admins had more questions.
Our customer advisory board provided clear feedback, they wanted to know how students and faculty were using Logos. What books were they reading? What tools were they using? Which classes were seeing poor adoption and which were thriving?
The Scope of this Case Study
From here on down I’m focusing on the design decisions around filtering and segmenting the data on the Analytics screens. While I was responsible for the design of the whole feature, it’s too much to ground to cover here.
How it Started
I returned from paternity leave (her name is Raelle ☺️) and learned that the product manager had already built a proof-of-concept prototype with Copilot to address the problems outlined above, but then stalled out. It gestured at powerful filtering and a dimension comparison, but it didn’t present these new interactions in a usable way.
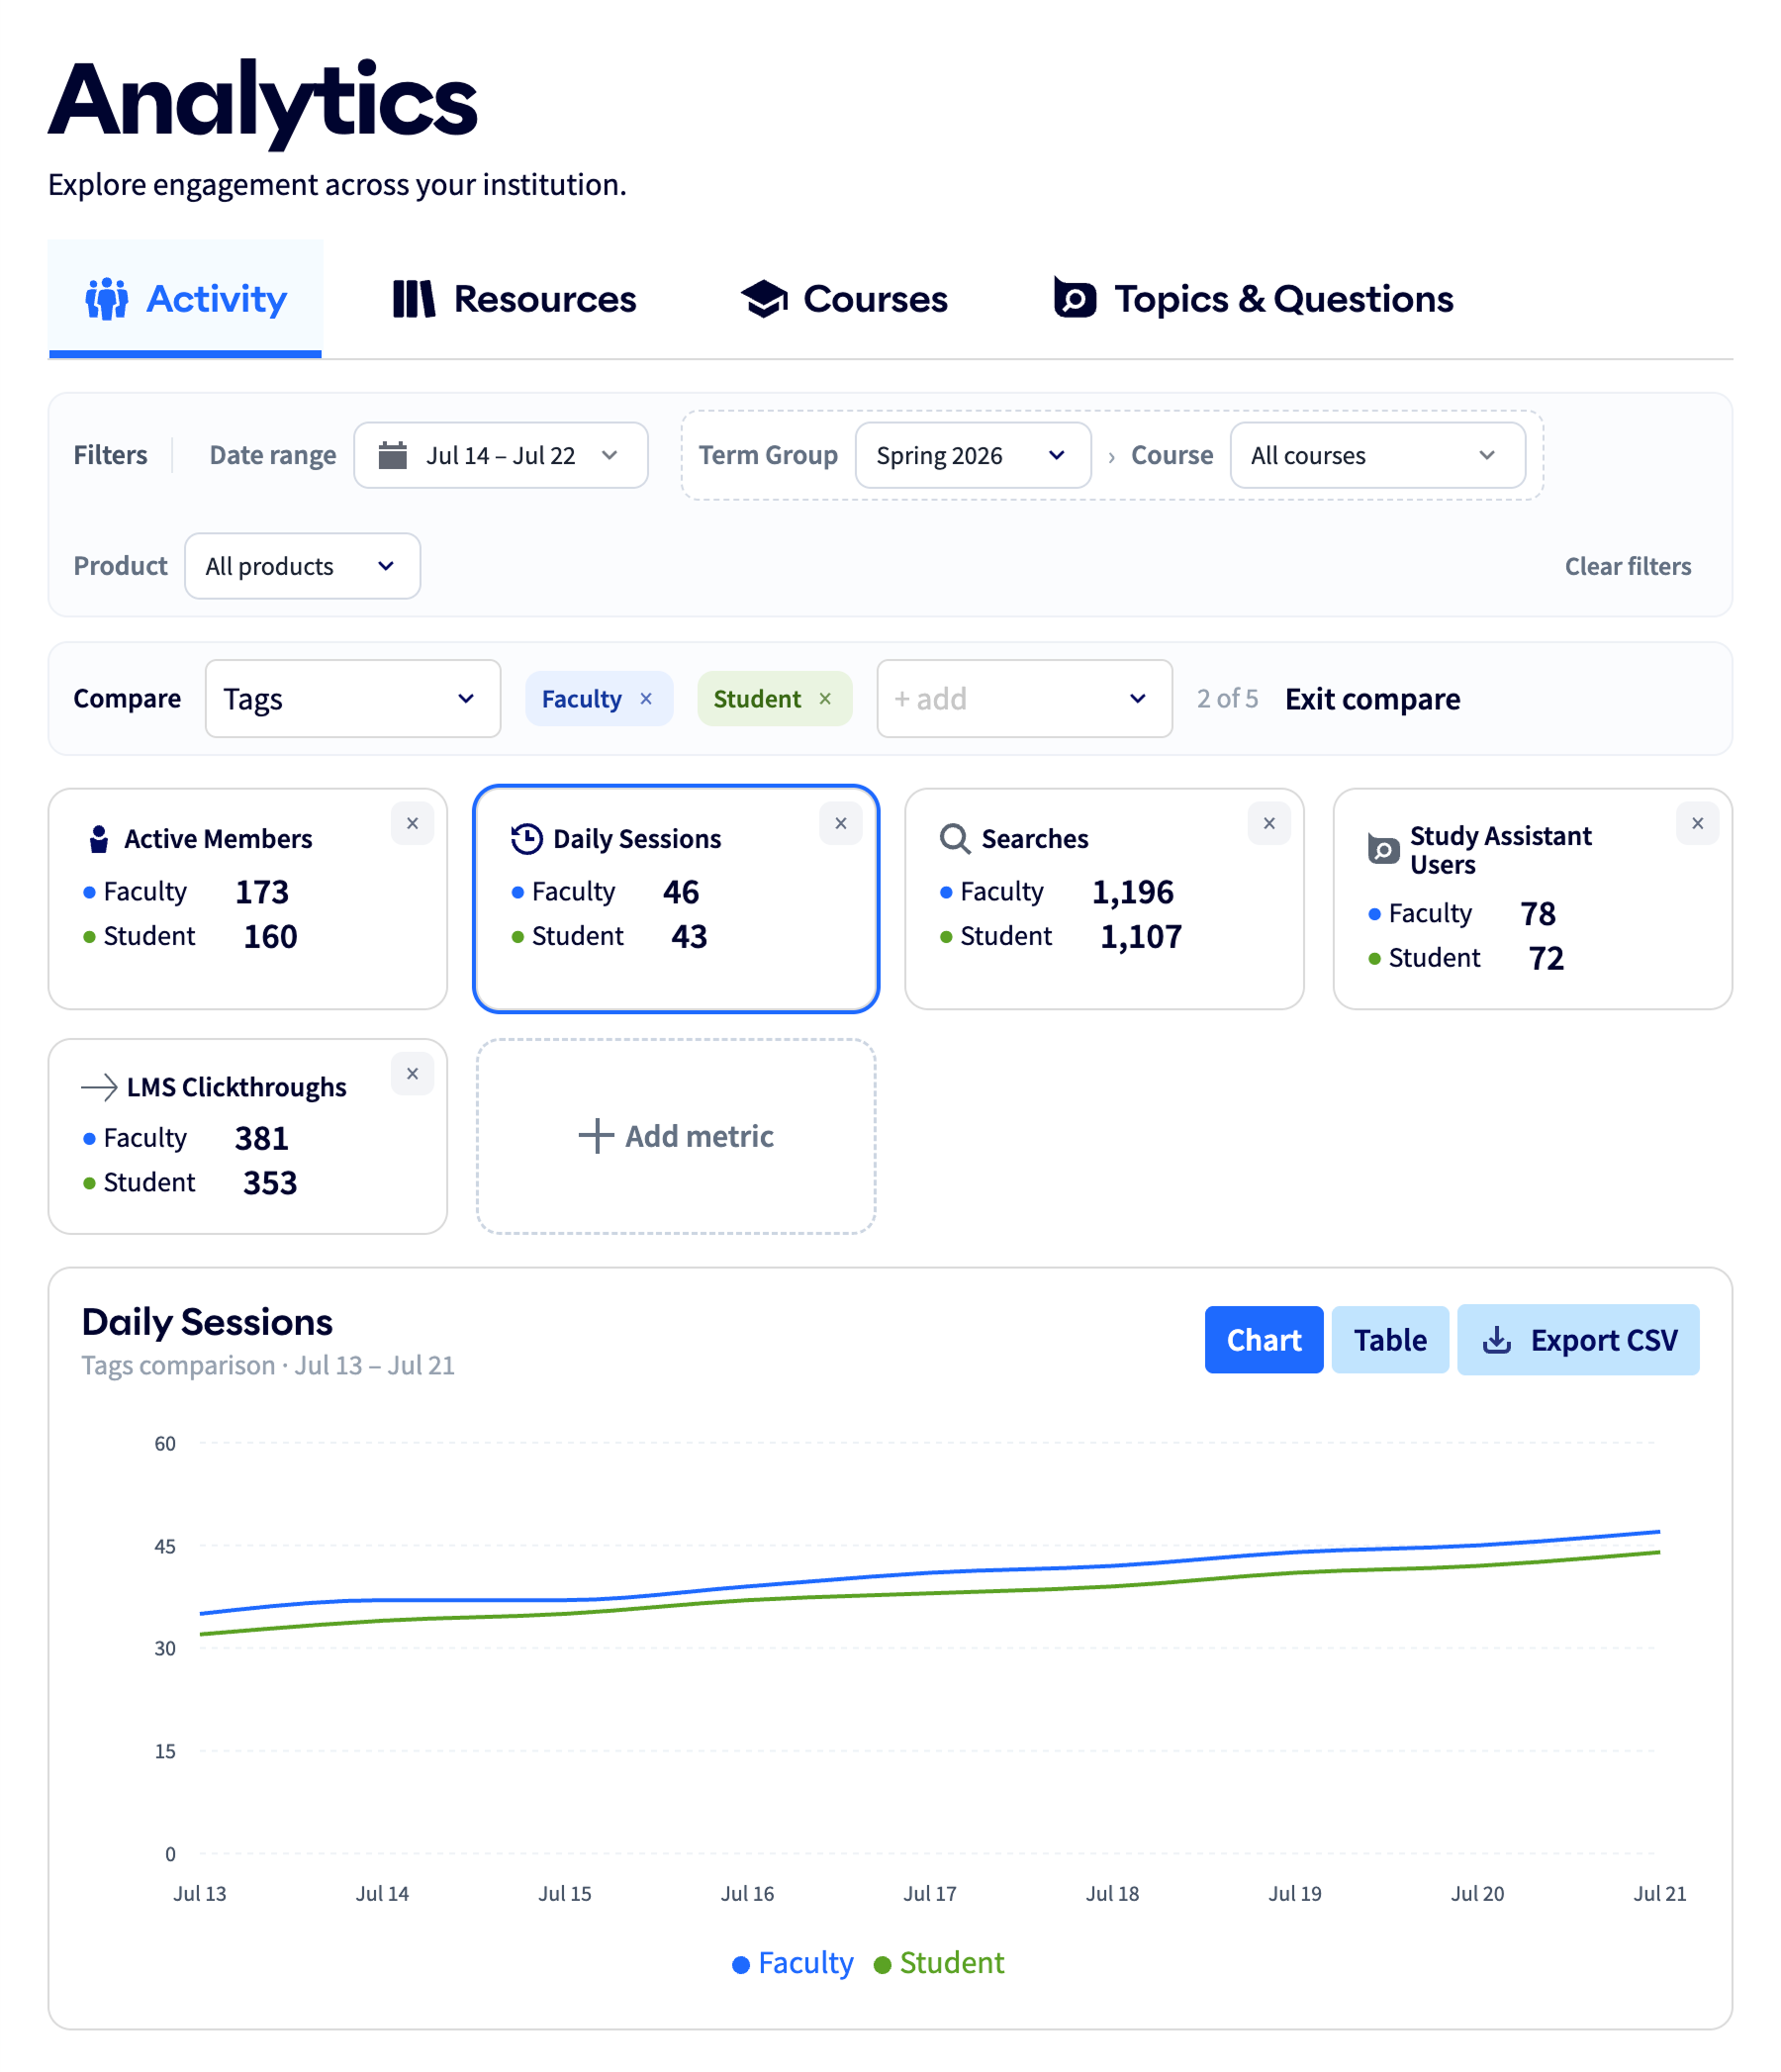
There was friction at multiple spots:
- The toolbar read as a list of unrelated controls rather than a powerful set of tools.
- Active states were inconsistent. A filtered chip looked different from an active date picker, which looked different from an active comparison.
- The metric cards and the chart they controlled were in separate space, making it unclear they were related. The ability to add metric cards had the unintended result of making the non-default metrics difficult to discover.
- The date range value unintuitively constrained the user from filtering or comparing based on course. This odd interaction wasn’t random, though — it was the symptom of underlying complexity in the term data that schools provide.
- Previous period comparison was missing, which was an issue because we already supported it on the Dashboard’s summary analytics.
My Approach
I’d build off of the existing mock dataset and page structure, but build new components and their interactions from scratch. The primary design deliverable would be a production-quality prototype built with Copilot.
What I designed
Filtering and Segmenting
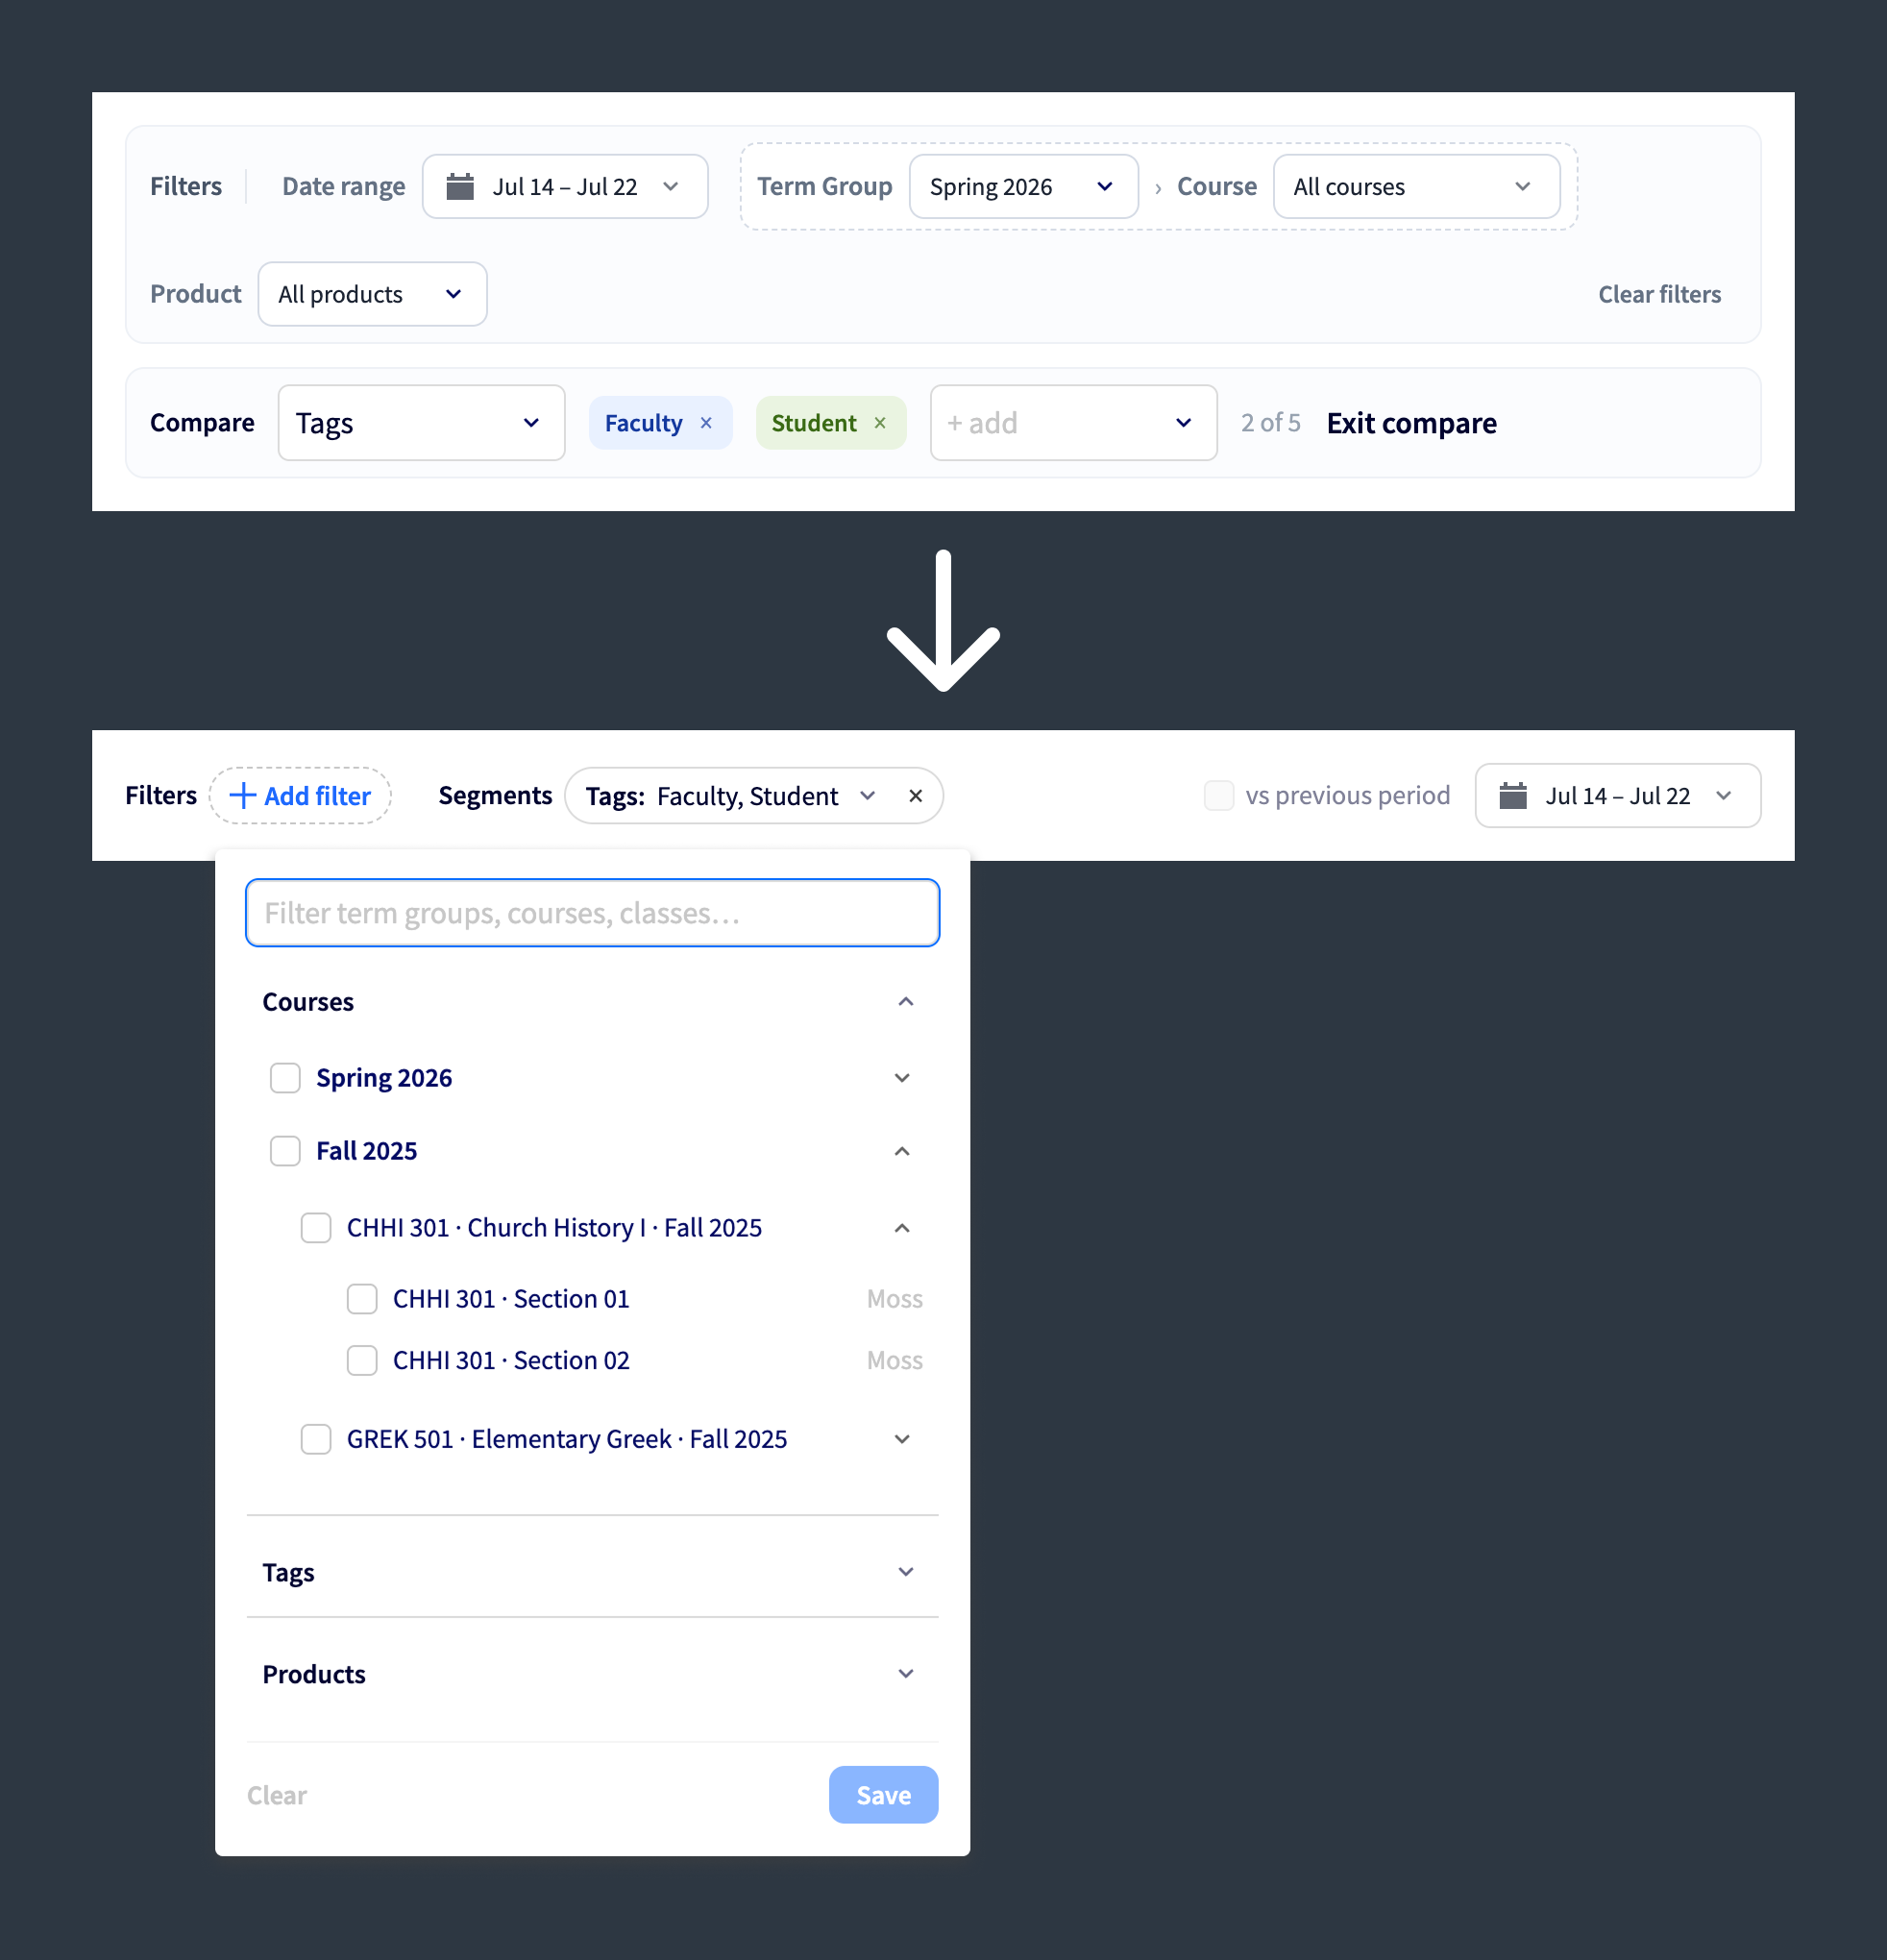
- Filters control (reduce) which members’ data is visible.
- Applied filters are grouped by dimension into chips
- Segments group the visible siblings of a single dimension for side-by-side comparison
- Course filters or segments drive the date picker, but it’s a one-way street. This follows the way university admins are more interested in what happened in the previous term than in the month of March.
- This dimension is special because in addition to being properties on person records (as anticipated), each instance also has start/end date properties
- Previous period comparison is on by default and gracefully disables when segments or certain incompatible filters are applied.
Outcomes
This feature is in active development (as of July 2026) so we can’t yet measure the impact, but we’ve shown the prototype to customers in focus groups and had overwhelmingly positive reactions to the new capabilities. When we showed a university admin course-level filtering on the end-user adoption metrics he wanted to use to assess faculty effectiveness, he replied, “This is awesome. I mean, incredible.”
To measure success I’ll be watching for:
- AI-analyzed Customer Success interactions where this feature, or the data it presented, helped to retain or acquire a customer
- correlation between engagement with these pages and churn rate
- correlation between engagement with these pages and end-user license claim rate (a proxy for end-user adoption)